The Secret Hidden in Your Profit Structure, Uncovered by CVP Analysis
Mr. Kim, who runs a restaurant, punches numbers into his calculator every night. Today: 350,000 won in sales, 150,000 won for ingredients, 80,000 won for labor, 120,000 won for rent... and in the end, nothing is left. “Sales keep climbing, so why is there never any money left over?”
What Mr. Kim is missing is simple: his costs don’t all behave the same way. Ingredient costs climb as more customers come in, but rent goes out every month even if not a single customer shows up. Until you understand that difference, your profit structure won’t improve no matter how much you grow sales.
Fixed Costs vs. Variable Costs: The Line That Decides Your Fate
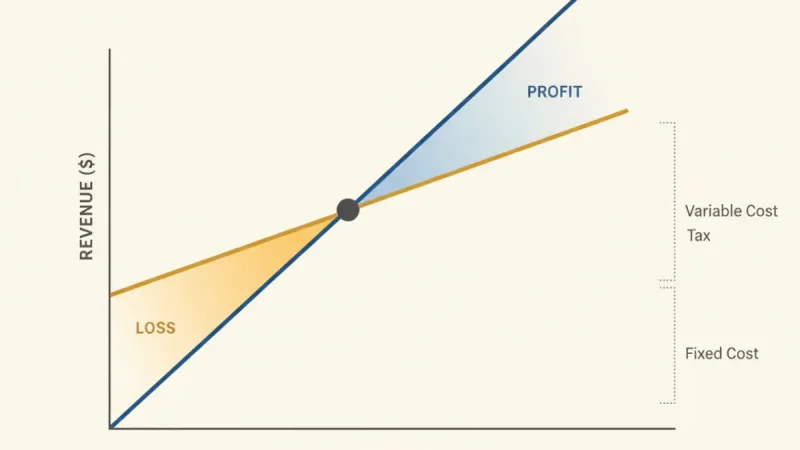
CVPCost-Volume-Profit analysis begins at exactly this point. It’s a tool that divides costs into fixed and variable, then calculates how changes in sales volume affect profit. In Mr. Kim’s restaurant, the 120,000 won in rent is a fixed cost, while ingredients are a variable cost that accounts for 43% of sales.
So how much does Mr. Kim need to sell to reach his break-even point? The formula is simple: divide fixed costs by the contribution margin ratio. The contribution margin ratio is the share of sales that remains after subtracting variable costs. For Mr. Kim’s restaurant, that comes to 57% (100% − 43%).
Break-even sales
= Fixed costs ÷ Contribution margin ratio
= 200,000 won ÷ 0.57
= about 350,000 won
If Mr. Kim brings in 350,000 won a day, he has only just broken even. To turn a real profit, he has to clear that 350,000 won. And here’s one crucial fact: 57% of every won earned beyond 350,000 won stays in his pocket as pure profit.
The Magic of Marginal Contribution
The heart of CVP analysis lies in “marginal contribution” — the net profit you earn each time one more customer walks in. If Mr. Kim sells one more 10,000-won set meal, he keeps 5,700 won as net profit after subtracting 4,300 won in ingredient costs. That’s because the fixed costs have already been covered by other sales.
Grasp this concept and your pricing strategy changes. Picture 3 p.m., after the lunch rush, when customers are scarce, and you put out a special priced at 8,000 won. Conventionally, you might call it a “loss.” But how does it look from a CVP perspective? Subtract 4,300 won in ingredient costs from that 8,000 won, and you’ve generated an extra 3,700 won in profit.
Of course, a strategy like this comes with conditions. It can’t cannibalize your regular-menu customers, and you have to weigh your brand image. Still, because it lets you calculate “the value of incremental sales” with precision, CVP analysis proves to be a powerful tool.
The Wisdom of Working Backward From a Profit Target
CVP analysis doesn’t just hand you your break-even point. It also lets you set goals like, “How much do I need to sell to earn 1 million won in net profit a month?” If Mr. Kim wants 1 million won in monthly profit, the formula shifts like this.
Target sales
= (Fixed costs + Target profit) ÷ Contribution margin ratio
= (6 million won + 1 million won) ÷ 0.57
= about 12.28 million won
The math says he needs to bring in 12.28 million won a month — an average of 410,000 won a day. He only has to add 60,000 won to his current 350,000 won, but that 60,000 won carries more weight than it seems. Of the extra 60,000 won in sales, 34,000 won stays as net profit.
The Management Philosophy Hidden Behind the Numbers
The real insight CVP analysis offers lies in “structural improvement.” Rather than scrambling merely to boost sales, it forces you to look at the cost structure itself. What if Mr. Kim could cut his rent by 50,000 won? His break-even point would drop to 260,000 won. Suddenly he has solid grounds to judge which is more realistic: growing sales or trimming costs.
Of course, CVP analysis has its limits, too. In a real business, it’s hard to sort every cost cleanly into fixed and variable, and the variable-cost ratio can shift as sales volume rises. But even granting those limits, CVP analysis remains a powerful tool precisely because it lets you understand a business’s profit structure in hard “numbers.”
In the end, management isn’t about gut feeling — it’s about calculation. How much can you keep from each won of sales? How much fixed cost can you bear? How much more do you need to sell to hit your profit target? CVP analysis gives a clear answer to every one of these questions. For every business owner agonizing over a calculator, CVP isn’t just an accounting technique — it’s a compass for survival.